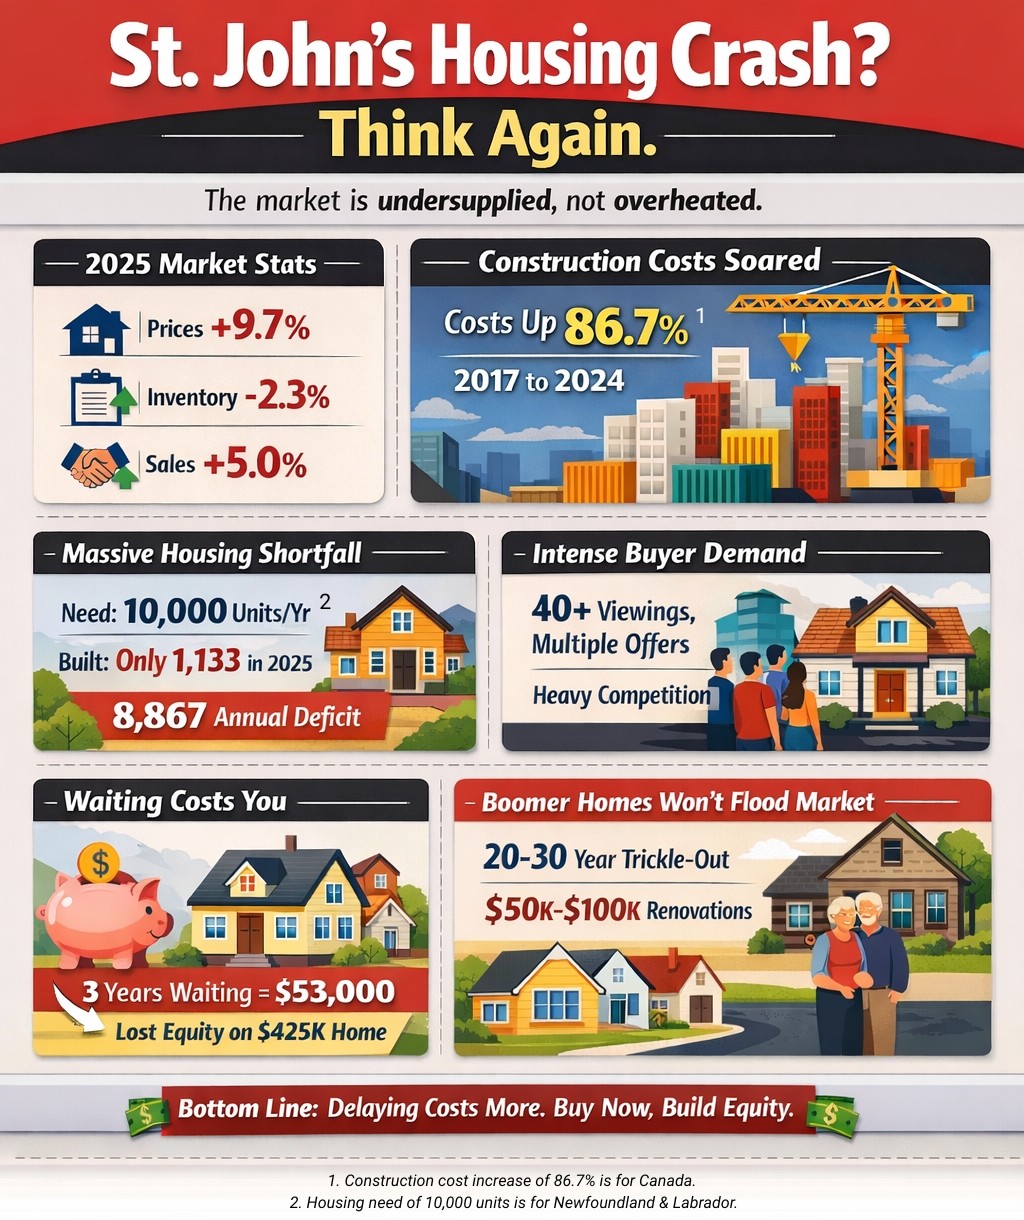
The St. John’s housing crash people are expecting is not coming. The market is undersupplied, not overheated. Construction costs rose 86.7% from 2017 to 2024. The province needs 10,000 new homes per year but started only 1,133 in 2025. Waiting for lower prices means paying more later while missing equity gains now.
- St. John’s home prices rose 9.7% in 2025 while inventory dropped 2.3% and sales increased 5.0%.
- The cost to construct a residential building in Canada rose 86.7% from Q1 2017 to Q4 2024, according to Stats Canada.
- Newfoundland needs 10,000 housing units per year but produced only 1,133 in 2025, creating an 8,867 unit annual deficit.
- Properties receive multiple offers with 40+ viewings in five days. Demand exceeds supply by wide margins.
- Waiting three years costs $53,000 in lost equity on a $425,000 home appreciating at 4% annually.
I used to believe the crash was coming.
Every market goes up. Every market comes down. That is how it works. I watched prices climb in St. John’s and assumed gravity would apply eventually.
Then I saw the Q2 2025 data.
Active listings dropped 1.8% from the same period in 2024. Unit sales jumped 16.7%. Properties were getting 20 offers. Some listings had 40+ viewings in five days and closed with 20+ competing bids.
The crash narrative stopped making sense.
The market is not overheated. It is undersupplied. There is a difference. Price increases are not speculation. They are math.
What Do the Market Numbers Actually Show?
The 2025 St. John’s Metro Housing Market report shows three metrics moving in the same direction.
Transaction volume increased 5.0%. Sales rose from 3,152 units in 2024 to 3,310 units in 2025. That is 158 additional sales despite elevated pricing.
Average sale price surged 9.7%. Prices climbed from $386,647 to $424,158. A $37,511 increase in one year.
Active inventory declined 2.3%. Monthly average available homes dropped from 1,495 to 1,461 properties.
Most people see the 2.3% inventory decline and think it is small.
It is not small when 5% more people bought homes while inventory went down.
The gap between what people want and what is available is growing. As of February 1st, 2026, the St. John’s CMA had approximately 1.4 months of inventory according to NLAR Matrix system data. When supply drops below 2 months, competition drives cost. Interest rates become secondary.
Bottom Line: Transaction velocity increased while supply contracted. More buyers competed for fewer homes. Competition determines price when supply drops below 2 months of inventory.
Why Are Construction Costs Setting a Rising Price Floor?
People see prices going up and think bubble.
I see the floor moving.
Stats Canada Building Price Indexes show construction costs for residential buildings in St. John’s CMA have increased significantly since 2020. Since 2023 (the year Stats Can rebased the index to 100,) the index for St. John’s has risen to 109.7 or a 9.7%, an average of almost 3.3% per year.
The construction floor continues rising. This does not include land prices, which are climbing, or excavation costs, which are increasing.
Nationally, construction costs for residential buildings rose 3.7% in Q4 2024 alone. Builders reported continued cost pressure from skilled labor shortages, labor rate increases, building code changes, and land availability constraints.
Nationally, construction costs for residential buildings rose 86.7% from Q1 2017 to Q4 2024.
This is not speculation. This is the documented rising floor of what building actually costs.
Existing homes eventually trend toward the cost of building a new one. Since it is becoming drastically more expensive to build, the floor for all home prices is rising.
Bottom Line: Construction costs set the price floor for all housing. When it costs 86.7% more to build than it did in 2017, existing homes trend toward that replacement value.
How Big Is the Supply Deficit?
A 2024 CMHC housing report estimated Newfoundland and Labrador needed 60,000 new housing units built in the next six years.
That means 10,000 new homes per year.
Housing starts in Urban Newfoundland and Labrador increased by only 120 units in 2025. Total starts: 1,133 units.
The province needs 10,000 units per year. It is getting 1,133.
That is not a gap. That is a chasm.
If the province needs 10,000 units but only builds 1,133, we are not just missing the mark. We are falling 8,867 units further behind every single year.
Nationally, CMHC’s June 2025 report shows that returning to 2019 affordability levels will require between 430,000 and 480,000 new housing units be built annually over the next decade. That represents approximately double the current pace of home construction in Canada.
The Canada Housing Infrastructure Fund is investing $123.1 million over 10 years to help with water and sewer for new developments in Newfoundland and Labrador.
It is not enough. It is not fast enough.
Back during the housing construction boom of 2012, 3,885 houses were started in Newfoundland and Labrador. The 2025 number of 1,133 is a far cry from what the market needs.
Bottom Line: The deficit compounds annually. New construction velocity is 88.7% below required levels. This gap widens every year supply fails to meet demand.
What Four Factors Are Constraining Supply?
Most people analyze these factors separately.
You need to see how they compound.
First, new construction cannot keep pace. Starting prices for small, new construction townhomes are now in the $400,000+ range. That puts them out of range for a large part of the entry-level buyer. New home contractors cannot build fast enough to overcome demand. Shortage of developed land. Increasing land prices. Labor shortages. Increasing supply costs.
Second, seniors are staying longer. Baby boomers aged 56 to 75 years accounted for 41.3% of homeowners in Canada in 2021. Inventory that would traditionally cycle back to market is not cycling. Most boomers are likely to retain their houses for more than 10 years after age 65.
Third, land is scarce. Developed land is limited. Excavation costs are increasing. Municipal approval processes create delays.
Fourth, the inventory that does exist requires work. People are purchasing resale homes that require significant amounts of work and underestimating the true cost of renovations. They may have won the bidding war, but they will have to plan and compromise on what they want to do with their property.
When you put all four together, the timeline before supply catches up to demand is 5 to 10 years out.
Bottom Line: Four supply constraints operate simultaneously. New construction lags. Boomers hold inventory. Land is limited. Resale stock needs capital investment. Supply will not catch demand for 5 to 10 years.
Why Does Timing the Market Fail in a Shortage?
Buyers often wait for interest rates to drop.
Here is the problem.
In Newfoundland and Labrador, even as national trends cooled, prices in St. John’s rose 9.7% in 2025. A 1% drop in mortgage rates does not help if the house price has jumped $40,000 while you waited.
There is years of latent demand from buyers who have already been waiting. The moment rates dip further, these buyers will flood the market. Bidding wars will erase any savings from a lower rate.
I listed 20 Ferryland Street East with a Seller’s Direction providing for 5 days of viewings and then presentation of offers. We had over 40 viewings and 11 offers. The house sold for well over asking and even what I thought it would sell for.
This is the current market reality.
Bottom Line: Rate reductions trigger pent-up demand. Buyers flood back when rates drop. Bidding wars eliminate rate savings through price appreciation.
Will the Baby Boomer Inventory Wave Save You?
Some people are waiting for baby boomer housing to hit the market.
The demographic shift peaks in the mid-2040s when this cohort reaches their late 80s.
That inventory will be released gradually over a period of 20 to 30 years. Not all at once.
Many of these homes, averaging around 39 years old, will require significant capital-intensive renovations. Plumbing. Electrical. Structural.
You are not getting a deal. You are getting a project.
And the construction costs to fix those projects will be even higher than they are today.
Wealth transfer will keep some homes off the market. Many seniors may pass their homes down to their children, who may choose to live in them or rent them out rather than selling immediately.
High demand from immigration could absorb much of the incoming inventory, keeping prices from falling sharply.
Some seniors may choose to remain in their homes for as long as possible due to the high costs of moving or the lack of suitable downsizing options. This further delays the influx of supply.
Bottom Line: Boomer inventory releases gradually over 20 to 30 years. Those homes require major renovations at higher future construction costs. Demographic shift does not create immediate supply relief.
What Does Waiting Actually Cost?
Waiting costs you twice.
First, you pay rent which is 100% interest with zero equity building.
Second, you miss the appreciation.
If prices increase 4% annually and you wait three years, that $425,000 house becomes $478,000. You just lost $53,000 in equity you could have been building.
I think we are looking at new home construction price increases in the range of 4% to 8% per year when you take increasing land costs into account.
A turnkey house costing $575,000 in 2026 will cost between $598,000 and $621,000 in 2027. At the conservative end, you are looking at almost $700,000 by 2030.
People think they are being smart by waiting for the perfect moment.
The “perfect” moment was 2 years ago. The second best moment is right now.
Because in five years, when that senior housing finally starts trickling onto the market, those homes will need $50,000 to $100,000 in renovations.
The math does not support waiting. It supports getting in now, locking in your cost basis, and letting time work for you instead of against you.
Bottom Line: Delay costs compound. Rent is 100% interest. Price appreciation creates equity loss. Three-year delay on a $425,000 home costs $53,000 in foregone equity at 4% appreciation.
What Is the Real Risk of Waiting?
Waiting does not just cost money. It costs choice.
As the supply gap widens, buyers are forced into smaller homes or less desirable neighborhoods just to stay within budget.
While you are waiting for the perfect moment, you are paying 100% interest or missing out on the 10% annual appreciation currently projected for the St. John’s market through 2026.
You are not buying at the top when there is a massive structural deficit.
You are buying before the next 8,000 unit shortage hits the market.
You can refinance a mortgage. You cannot rebuy a house at last year’s price.
The entire metro area is experiencing the same trends. St. John’s. Mount Pearl. Paradise. CBS. All moving together.
This is not a neighborhood issue. It is a regional supply problem driven by macroeconomic and demographic forces.
Real estate is local. It cannot be moved like other assets.
The larger markets garner all the attention. Toronto. Vancouver. Calgary. The entire Newfoundland and Labrador housing market is just a small fraction of the larger centers.
What happens here does not impact the Canadian market in any appreciable amount.
But it impacts you if you live here.
Bottom Line: Regional supply constraints affect local buyers regardless of national trends. Forced compromise on size or location becomes the outcome when supply lags demand.
What the Data Says About the Crash That Is Not Coming
Housing prices have steadily increased in Newfoundland since 1990.
Over the long term, purchasing a home is a solid investment that forces people to save through building equity by paying down their mortgage and price appreciation. It also provides a place to build memories.
Given the current high demand and low inventory, this market will continue into 2026 with many predicting an increase of 10% in average residential prices.
The construction floor is rising 3%+ annually. The supply deficit is compounding. Seniors are staying longer. Buyers are still competing with 11 offers on properties.
The crash is not coming because the fundamentals do not support it.
Lock in your cost basis now. Let time work for you instead of against you.
Stop waiting for perfect. Start building equity today.
Frequently Asked Questions
When will the St. John’s housing market crash?
The data does not support a crash scenario. The market operates under structural supply deficit conditions. The province needs 10,000 units annually but builds 1,133. Construction costs rose 86.7% from Q1 2017 to Q4 2024. Supply constraints will persist for 5 to 10 years minimum.
Should I wait for interest rates to drop before buying?
Waiting for rate drops triggers opportunity cost. St. John’s prices rose 10.9% in early 2025 despite high rates. A 1% rate reduction does not offset a $40,000 price increase. Latent demand floods the market when rates drop, erasing savings through bidding wars.
What happens when baby boomers sell their homes?
Boomer inventory releases gradually over 20 to 30 years, not all at once. Peak release occurs in the mid-2040s. These homes average 39 years old and require $50,000 to $100,000 in renovations. Construction costs will be higher then. Wealth transfers and immigration demand will absorb much of the supply.
Why are construction costs rising so fast?
Multiple cost pressures compound simultaneously. Skilled labor shortages. Labor rate increases. Building code changes. Land availability constraints. Material costs. Stats Canada data shows construction costs rose 86.7% from Q1 2017 to Q4 2024 nationally.
What does waiting to buy actually cost me?
Waiting creates dual cost. Rent is 100% interest with zero equity building. Price appreciation compounds annually. Waiting three years on a $425,000 home appreciating at 4% costs $53,000 in foregone equity. You pay more later for less choice.
Is St. John’s inventory really that low?
Inventory in the St. John’s CMA dropped to approximately 1.4 months as of February 1st, 2026. Below 2 months signals severe supply constraint. Properties are still receiving multiple offers. One listing had 40 viewings and 11 offers in five days. Competition sets price when supply falls below critical thresholds.
Will new construction solve the supply problem?
New construction velocity is insufficient. Urban Newfoundland and Labrador produced 1,133 units in 2025. Required production is 10,000 units annually. The gap creates an 8,867 unit annual deficit. Entry-level townhomes now start at $400,000+, pricing out many first-time buyers.
Key Takeaways
- The St. John’s housing market operates under structural supply deficit, not speculative bubble conditions. Prices rose 9.7% while inventory dropped 2.3% and sales increased 5.0% in 2025.
- Construction costs set the rising price floor. The cost to construct a residential building in Canada rose 86.7% from Q1 2017 to Q4 2024, establishing a new baseline for all housing values.
- The province needs 10,000 housing units annually but produces only 1,133, creating an 8,867 unit annual deficit that compounds every year.
- Four supply constraints operate simultaneously. New construction lags demand. Baby boomers retain 41.3% of housing inventory. Land is scarce. Resale inventory requires capital-intensive renovations.
- Waiting for rate drops triggers pent-up demand that eliminates savings through bidding wars. St. John’s prices rose 10.9% in early 2025 despite elevated interest rates.
- Boomer inventory releases gradually over 20 to 30 years starting in the mid-2040s. These homes will require $50,000 to $100,000 in renovations at higher future construction costs.
- Delay costs compound through rent payments and missed appreciation. Waiting three years on a $425,000 home costs $53,000 in foregone equity at 4% annual appreciation.
Sources and Citations are available upon request.
Email: he***@*********ms.ca